Oakland County, MI, is a popular choice for homebuyers because of its excellent education, family-friendly atmosphere, and proximity to job opportunities and cultural attractions.
The area offers a mix of homes for sale Oakland County MI, with property values that have been steadily appreciating, making it a potentially sound long-term investment.
Oakland County Market at a Glance
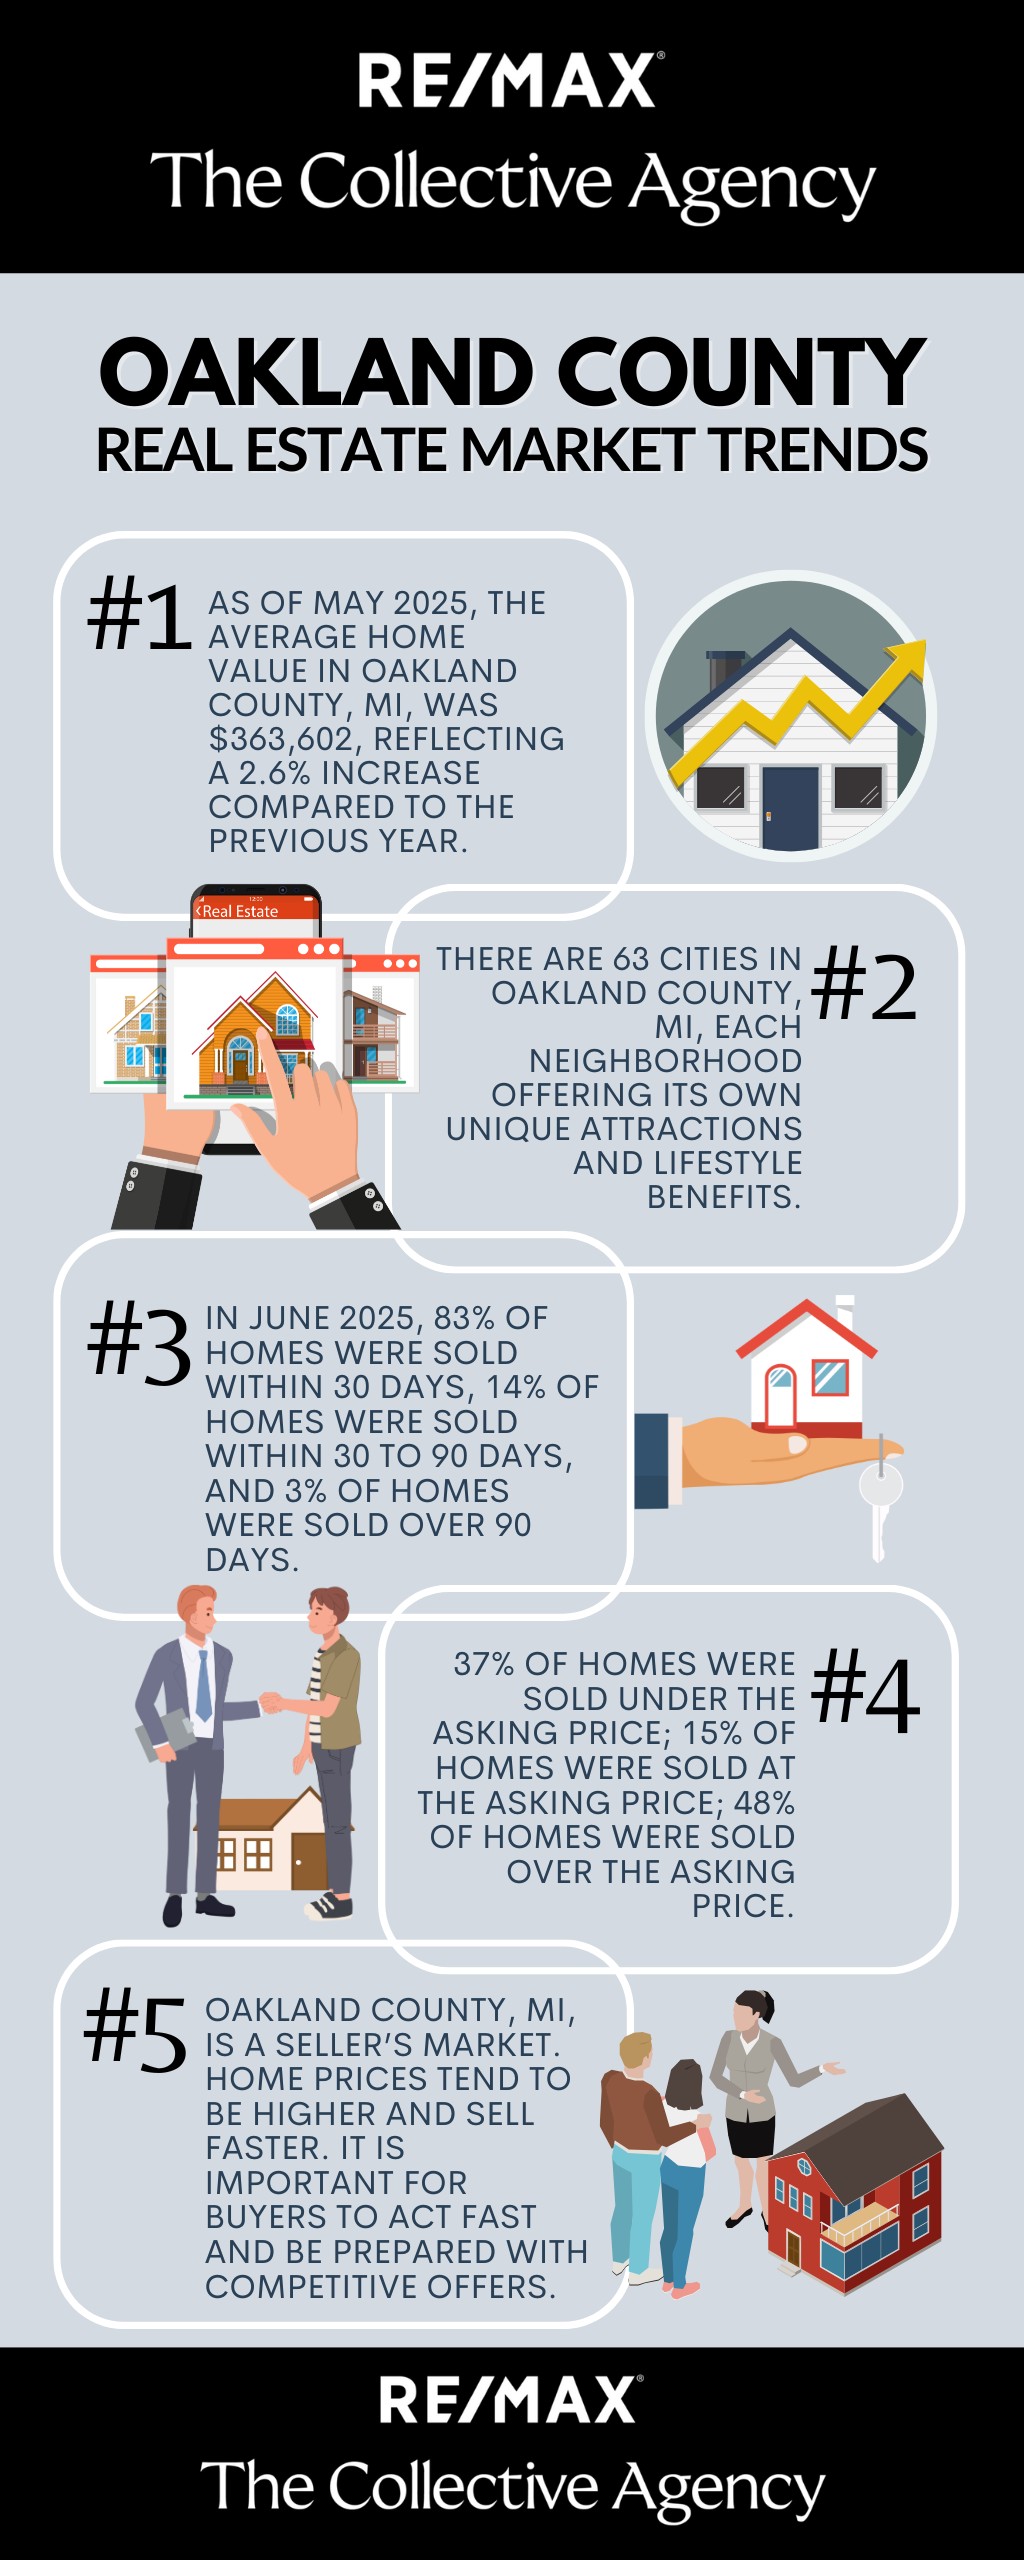
There are more people looking to buy than there are homes for sale in Oakland County MI, so it is a seller’s market. As such, home prices tend to be higher and sell faster. It is important for buyers to act fast and be prepared with competitive offers.
As of May 2025, the average home value in Oakland County, MI, was $363,602, reflecting a 2.6% increase compared to the previous year. During this time, the housing inventory had 3,173 homes for sale, with 1,609 new listings.
The median sale price of homes was $313,333, while the median list price was $374,967. The percentage of home sales over list price was 37.7%, while 46.7% of homes were sold under list price.
In June 2025, the median home sold price in Oakland County was $361,343, up 5.5% from 2024. The median price per square foot was $178.
There are 63 cities in Oakland County, MI, each neighborhood offering its own unique attractions and lifestyle benefits.
Birmingham and Bloomfield Hills are desired for their upscale homes and luxurious amenities. These neighborhoods appeal to buyers seeking a high-end living experience. Birmingham is the most expensive city, with a median listing home price of $1.6 million.
On the other hand, communities like Ferndale and Royal Oak are sought after for their vibrant downtown areas and more affordable housing options. Pontiac is the most affordable city, with a median listing home price of $149,900.

Inventory Levels and Buyer Competition
The Oakland County real estate market is currently experiencing high demand and low inventory. This results in increased competition among buyers, with prices on the rise and properties selling quickly.
Compared to May 2025, the Oakland County housing inventory in June 2025 for 1-bedroom homes increased by 23.1%, 2-bedroom homes increased by 21.4%, 3-bedroom homes increased by 26.4%, 4-bedroom homes increased by 24.3%, and 5-bedroom homes and above increased by 34.5%.
| No. of Bedrooms | May 2025 | Jun 2025 | Variance MoM |
|---|---|---|---|
|
1 Bedroom |
52 |
64 |
+23.1% |
|
2 Bedrooms |
700 |
850 |
+21.4% |
|
3 Bedrooms |
1,600 |
2,023 |
+26.4% |
|
4 Bedrooms |
1,147 |
1,426 |
+24.3% |
|
5+ Bedrooms |
296 |
398 |
+34.5% |
Overall, there was an increase of 13.4 % in homes sold, with 930 properties sold in May and 1,055 homes sold in June.
Many Oakland County homes for sale are selling fast. If you’re planning to buy, act quickly. In June 2025, 83% of homes were sold within 30 days, 14% of homes were sold within 30 to 90 days, and 3% of homes were sold over 90 days.

What Homes Are Selling For
As of June 2025, most home buyers in the Oakland County housing market paid more than the asking price. Of the 1,055 homes sold:
- 37% of homes were sold under the asking price: 392 homes
- 15% of homes were sold at the asking price: 157 homes
- 48% of homes were sold over the asking price: 506 homes
Price Trends by Home Type and Bedrooms
Below is a table showing Oakland County the median home sold prices by bedroom count for June 2025 in comparison to the previous year.
| No. of Bedrooms | June 2024 | June 2025 | Variance YoY |
|---|---|---|---|
|
1 Bedroom |
$125,000 |
$121,000 |
-3.2% |
|
2 Bedrooms |
$217,500 |
$225,000 |
+3.4% |
|
3 Bedrooms |
$320,900 |
$332,200 |
+3.5% |
|
4 Bedrooms |
$500,000 |
$530,600 |
+6.1% |
|
5+ Bedrooms |
$725,000 |
$750,000 |
+3.4% |
Based on the table above, the median home sold price for 1-bedroom properties went down by 3.2%. For 2-bedroom homes, the median home sold price increased by 3.4%.
The median home sold price for 3-bedroom residences increased by 3.5%. For 4-bedroom properties, the median home sold price went up by 6.1%. And lastly, the median home sold price for 5-bedroom homes increased by 3.4%.

Key Factors Influencing the Oakland County Real Estate Market
Economic conditions in Oakland County, MI, play a significant role in shaping its housing market. Factors such as employment rates, income levels, and consumer confidence can influence home values as well as buyer activity.
Oakland County benefits from a diverse economy, with key industries including automotive, technology, and healthcare. Monitoring these economic indicators can provide practical insights into future market trends and potential shifts in buyer demand.
Seasonal trends can also affect the real estate activity in Oakland County, with certain times of the year experiencing higher demand for homes than others.
Spring and summer are often the busiest seasons for buying and selling, as the warmer weather and longer days encourage more buyers to explore their options.
On the other hand, the market typically slows down during the winter months, which offers potential opportunities for buyers to find deals.
Understanding these seasonal patterns can help both buyers and sellers time their transactions to get the most from their real estate transactions.
Conclusion
The Oakland County real estate market is highly competitive and working with an experienced real estate professional can provide valuable guidance and support to ensure you get the best deal, whether you’re a buyer or a seller.
If you’re exploring your home options in Oakland County, MI, please give us a call today at 248-780-0942 or contact us through this link.
Frequently Asked Questions
Is Oakland County, MI, a buyer's or seller's market right now?
Oakland County is a seller’s market, with more people looking to buy than there are homes for sale.
What is the median home price in Oakland County, Michigan?
In June 2025, the median home sold price in Oakland County was $361,343, up 5.5% from 2024. The median price per square foot was $178.
How much do homes sell for compared to their asking price in Oakland County?
As of June 2025, most home buyers in the Oakland County housing market paid more than the asking price. Of the 1,055 homes sold, 37% were sold under the asking price, 15% were sold at the asking price, and 48% of homes were sold over the asking price.